The increase was far from slight; it was massive. Here's my plot of the same data - just a bit larger.
Crime data is reported from the various states. The states in turn get their data from the locales. It doesn't appear that DOJ altered the data, but they do the next best thing - spin, spin, spin.
A quick perusal of the DOJ Bureau of Statistics Key Crime and Justice Facts at a Glance page delivers numerous reassuring messages. Crime is going down. Drug arrests are going up. And by the way some versions of these charts are proudly featured on the Whitehouse web site.
But a closer look at some of the details on that page reveals summaries absolutely loaded with convenient omission, "look over here" commentary, and occasional falsehoods. Here's an example. Click on the graph to reach the DOJ page.
The increase was far from slight; it was massive. Here's my plot of the same data - just a bit larger.

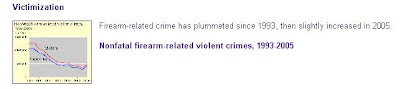
And this clarifies the point that describing the increase in 2005 as "slight" is plainly wrong.

OK, so a slight increase good mean just a little random variation or noise. It happens. But the truth is there's nothing slight about the increase in 2005.
Someone made the decision to cast a positive light on recent trends in the nation's crime rates. Who? Why? This is the Department of Justice, not The Martin Agency. When it comes to reporting data summaries creativity is not among the core skills needed.
Congress needs to find out who is making these decisions at BJS. And there's no need to wait. Thoroughness, accuracy and transparency are essential when it comes to crime trends. The public needs to be informed when crimes of a particular nature are on the rise.
For reference here is the data for the report.
| Years | Firearm incidents | Firearm victims | Firearm crime rates (Victims per 1,000 residents)
| Firearm crimes as a percent of all violent incidents | ||||||||
| 1993 | 1,054,820 | 1,248,250 | 5.9 | 11 | ||||||||
| 1994 | 1,060,800 | 1,286,860 | 6 | 11 | ||||||||
| 1995 | 902,680 | 1,050,900 | 4.9 | 10 | ||||||||
| 1996 | 845,220 | 989,930 | 4.6 | 10 | ||||||||
| 1997 | 680,900 | 795,560 | 3.6 | 9 | ||||||||
| 1998 | 557,200 | 670,480 | 3 | 8 | ||||||||
| 1999 | 457,150 | 562,870 | 2.5 | 7 | ||||||||
| 2000 | 428,670 | 533,470 | 2.4 | 7 | ||||||||
| 2001 | 467,880 | 524,030 | 2.3 | 9 | ||||||||
| 2002 | 353,880 | 430,930 | 1.9 | 7 | ||||||||
| 2003 | 366,840 | 449,150 | 1.9 | 7 | ||||||||
| 2004 | 280,890 | 331,630 | 1.4 | 6 | ||||||||
| 2005 | 419,640 | 477,040 | 2 | 9 | ||||||||
| Source: National Crime Victimization Survey | ||||||||||||